Compute and plot Association Plot
runAPL.RdComputes singular value decomposition and coordinates for the Association Plot.
runAPL.SingleCellExperiment: Computes singular value decomposition and coordinates for the Association Plot from SingleCellExperiment objects with reducedDim(obj, "CA") slot (optional).
runAPL.Seurat: Computes singular value decomposition and coordinates for the Association Plot from Seurat objects, optionally with a DimReduc Object in the "CA" slot.
Usage
run_APL(
  obj,
  group,
  caobj = NULL,
  dims = NULL,
  nrow = 10,
  top = 5000,
  clip = FALSE,
  score = TRUE,
  score_method = "permutation",
  mark_rows = NULL,
  mark_cols = NULL,
  reps = 3,
  python = FALSE,
  row_labs = TRUE,
  col_labs = TRUE,
  type = "plotly",
  show_cols = FALSE,
  show_rows = TRUE,
  score_cutoff = 0,
  score_color = "rainbow",
  pd_method = "elbow_rule",
  pd_reps = 1,
  pd_use = TRUE
)

runAPL(
  obj,
  group,
  caobj = NULL,
  dims = NULL,
  nrow = 10,
  top = 5000,
  clip = FALSE,
  score = TRUE,
  score_method = "permutation",
  mark_rows = NULL,
  mark_cols = caobj@group,
  reps = 3,
  python = FALSE,
  row_labs = TRUE,
  col_labs = TRUE,
  type = "plotly",
  show_cols = FALSE,
  show_rows = TRUE,
  score_cutoff = 0,
  score_color = "rainbow",
  pd_method = "elbow_rule",
  pd_reps = 1,
  pd_use = TRUE,
  ...
)

# S4 method for class 'matrix'
runAPL(
  obj,
  group,
  caobj = NULL,
  dims = NULL,
  nrow = 10,
  top = 5000,
  clip = FALSE,
  score = TRUE,
  score_method = "permutation",
  mark_rows = NULL,
  mark_cols = NULL,
  reps = 3,
  python = FALSE,
  row_labs = TRUE,
  col_labs = TRUE,
  type = "plotly",
  show_cols = FALSE,
  show_rows = TRUE,
  score_cutoff = 0,
  score_color = "rainbow",
  pd_method = "elbow_rule",
  pd_reps = 1,
  pd_use = TRUE,
  ...
)

# S4 method for class 'SingleCellExperiment'
runAPL(
  obj,
  group,
  caobj = NULL,
  dims = NULL,
  nrow = 10,
  top = 5000,
  clip = FALSE,
  score = TRUE,
  score_method = "permutation",
  mark_rows = NULL,
  mark_cols = NULL,
  reps = 3,
  python = FALSE,
  row_labs = TRUE,
  col_labs = TRUE,
  type = "plotly",
  show_cols = FALSE,
  show_rows = TRUE,
  score_cutoff = 0,
  score_color = "rainbow",
  pd_method = "elbow_rule",
  pd_reps = 1,
  pd_use = TRUE,
  ...,
  assay = "counts"
)

# S4 method for class 'Seurat'
runAPL(
  obj,
  group,
  caobj = NULL,
  dims = NULL,
  nrow = 10,
  top = 5000,
  clip = FALSE,
  score = TRUE,
  score_method = "permutation",
  mark_rows = NULL,
  mark_cols = NULL,
  reps = 3,
  python = FALSE,
  row_labs = TRUE,
  col_labs = TRUE,
  type = "plotly",
  show_cols = FALSE,
  show_rows = TRUE,
  score_cutoff = 0,
  score_color = "rainbow",
  pd_method = "elbow_rule",
  pd_reps = 1,
  pd_use = TRUE,
  ...,
  assay = SeuratObject::DefaultAssay(obj),
  slot = "counts"
)

# S4 method for class 'dgCMatrix'
runAPL(
  obj,
  group,
  caobj = NULL,
  dims = NULL,
  nrow = 10,
  top = 5000,
  clip = FALSE,
  score = TRUE,
  score_method = "permutation",
  mark_rows = NULL,
  mark_cols = NULL,
  reps = 3,
  python = FALSE,
  row_labs = TRUE,
  col_labs = TRUE,
  type = "plotly",
  show_cols = FALSE,
  show_rows = TRUE,
  score_cutoff = 0,
  score_color = "rainbow",
  pd_method = "elbow_rule",
  pd_reps = 1,
  pd_use = TRUE,
  ...
)
Arguments
- obj
A numeric matrix. For sequencing usually a count matrix, gene expression values with genes in rows and samples/cells in columns. Should contain row and column names.
- group
Numeric/Character. Vector of indices or column names of the columns to calculate centroid/x-axis direction.
- caobj
A "cacomp" object as outputted from `cacomp()`. If not supplied will be calculated. Default NULL.
- dims
Integer. Number of CA dimensions to retain. If NULL: (0.2 * min(nrow(A), ncol(A)) - 1 ).
- nrow
Integer. The top nrow scored row labels will be added to the plot if score = TRUE. Default 10.
- top
Integer. Number of most variable rows to retain. Set NULL to keep all.
- clip
logical. Whether residuals should be clipped if they are higher/lower than a specified cutoff
- score
Logical. Whether rows should be scored and ranked. Ignored when a vector is supplied to mark_rows. Default TRUE.
- score_method
Method to calculate the cutoff. Either "random" for random direction method or "permutation" for the permutation method.
- mark_rows
Character vector. Names of rows that should be highlighted in the plot. If not NULL, score is ignored. Default NULL.
- mark_cols
Character vector. Names of cols that should be highlighted in the plot.
- reps
Integer. Number of permutations during scoring. Default 3.
- python
DEPRACTED. A logical value indicating whether to use singular-value decomposition from the python package torch. This implementation dramatically speeds up computation compared to `svd()` in R when calculating the full SVD. This parameter only works when dims==NULL or dims==rank(mat), where caculating a full SVD is demanded.
- row_labs
Logical. Whether labels for rows indicated by rows_idx should be labeled with text. Default TRUE.
- col_labs
Logical. Whether labels for columns indicated by cols_idx shouls be labeled with text. Default FALSE.
- type
"ggplot"/"plotly". For a static plot a string "ggplot", for an interactive plot "plotly". Default "ggplot".
- show_cols
Logical. Whether column points should be plotted.
- show_rows
Logical. Whether row points should be plotted.
- score_cutoff
Numeric. Rows (genes) with a score >= score_cutoff will be colored according to their score if show_score = TRUE.
- score_color
Either "rainbow" or "viridis".
- pd_method
Which method to use for pick_dims (pick_dims).
- pd_reps
Number of repetitions performed when using "elbow_rule" in `pick_dims`. (pick_dims)
- pd_use
Whether to use `pick_dims` (pick_dims) to determine the number of dimensions. Ignored when `dims` is set by the user.
- ...
Arguments forwarded to methods.
- assay
Character. The assay from which extract the count matrix for SVD, e.g. "RNA" for Seurat objects or "counts"/"logcounts" for SingleCellExperiments.
- slot
character. The Seurat assay slot from which to extract the count matrix.
Details
The function is a wrapper that calls `cacomp()`, `apl_coords()`, `apl_score()` and finally `apl()` for ease of use. The chosen defaults are most useful for genomics experiments, but for more fine grained control the functions can be also run individually for the same results. If score = FALSE, nrow and reps are ignored. If mark_rows is not NULL score is treated as if FALSE.
References
Association Plots: Visualizing associations in high-dimensional
correspondence analysis biplots
Elzbieta Gralinska, Martin Vingron
bioRxiv 2020.10.23.352096; doi: https://doi.org/10.1101/2020.10.23.352096
Examples
set.seed(1234)
# Simulate counts
cnts <- mapply(function(x){rpois(n = 500, lambda = x)},
x = sample(1:100, 50, replace = TRUE))
rownames(cnts) <- paste0("gene_", 1:nrow(cnts))
colnames(cnts) <- paste0("cell_", 1:ncol(cnts))
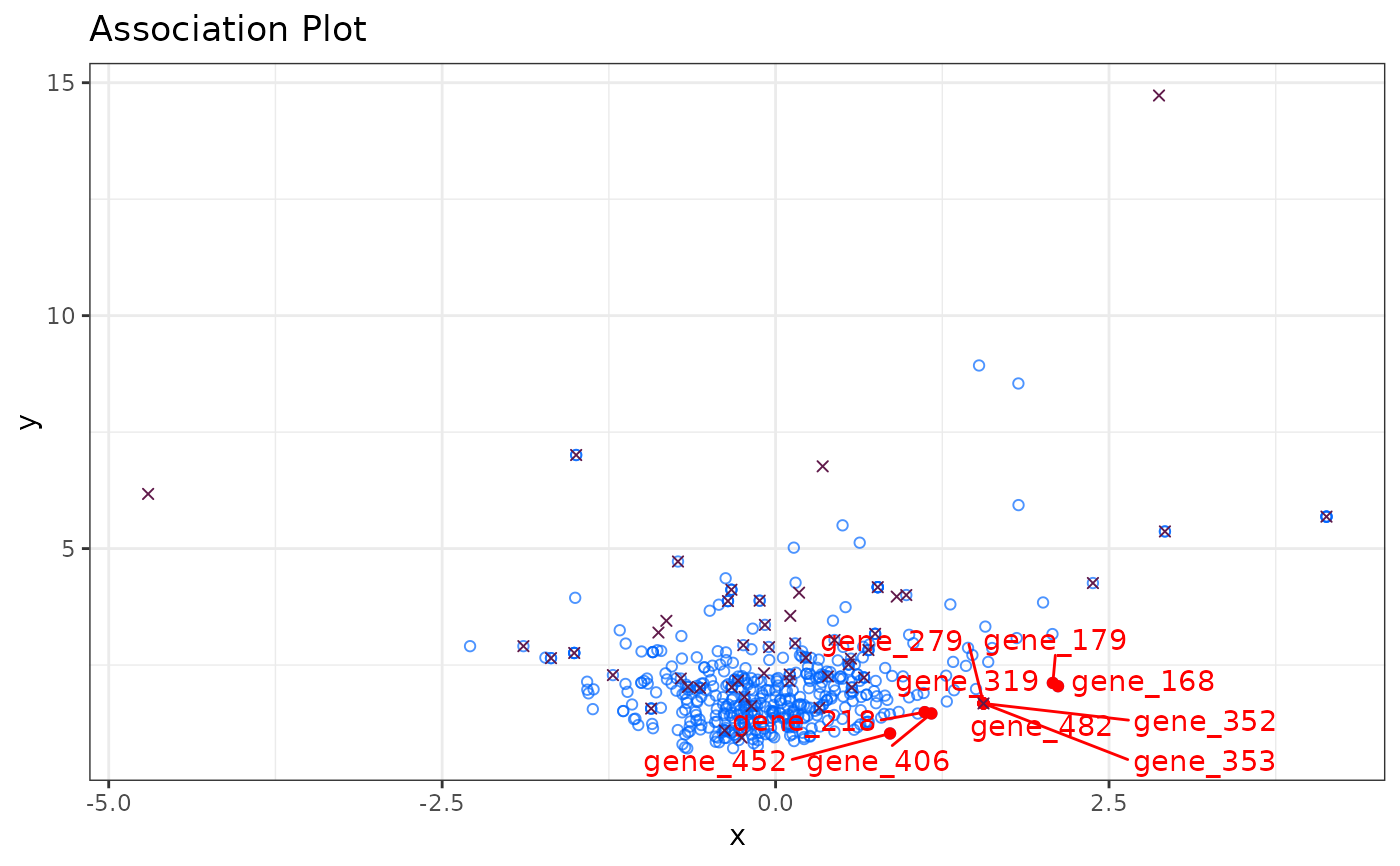
# (nonsensical) APL
APL:::run_APL(obj = cnts,
group = 1:10,
dims = 10,
top = 500,
score = TRUE,
show_cols = TRUE,
type = "ggplot")
#>
#> Both dims and pd_use set. Using dimensions specified by dims.
#>
#> Using 10 dimensions.
#>
|
| | 0%
|
|======================= | 33%
|
|=============================================== | 67%
|
|======================================================================| 100%
 set.seed(1234)
# Simulate counts
cnts <- mapply(function(x){rpois(n = 500, lambda = x)},
x = sample(1:100, 50, replace = TRUE))
rownames(cnts) <- paste0("gene_", 1:nrow(cnts))
colnames(cnts) <- paste0("cell_", 1:ncol(cnts))
# (nonsensical) APL
runAPL(obj = cnts,
group = 1:10,
dims = 10,
top = 500,
score = TRUE,
show_cols = TRUE,
type = "ggplot")
#>
#> Both dims and pd_use set. Using dimensions specified by dims.
#>
#> Using 10 dimensions.
#>
|
| | 0%
|
|======================= | 33%
|
|=============================================== | 67%
|
|======================================================================| 100%
set.seed(1234)
# Simulate counts
cnts <- mapply(function(x){rpois(n = 500, lambda = x)},
x = sample(1:100, 50, replace = TRUE))
rownames(cnts) <- paste0("gene_", 1:nrow(cnts))
colnames(cnts) <- paste0("cell_", 1:ncol(cnts))
# (nonsensical) APL
runAPL(obj = cnts,
group = 1:10,
dims = 10,
top = 500,
score = TRUE,
show_cols = TRUE,
type = "ggplot")
#>
#> Both dims and pd_use set. Using dimensions specified by dims.
#>
#> Using 10 dimensions.
#>
|
| | 0%
|
|======================= | 33%
|
|=============================================== | 67%
|
|======================================================================| 100%
 ########################
# SingleCellExperiment #
########################
library(SingleCellExperiment)
set.seed(1234)
# Simulate counts
cnts <- mapply(function(x){rpois(n = 500, lambda = x)},
x = sample(1:100, 50, replace = TRUE))
rownames(cnts) <- paste0("gene_", 1:nrow(cnts))
colnames(cnts) <- paste0("cell_", 1:ncol(cnts))
sce <- SingleCellExperiment(assays=list(counts=cnts))
# (nonsensical) APL
runAPL(obj = sce,
group = 1:10,
dims = 10,
top = 500,
score = TRUE,
show_cols = TRUE,
type = "ggplot",
assay = "counts")
#>
#> Both dims and pd_use set. Using dimensions specified by dims.
#>
#> Using 10 dimensions.
#>
|
| | 0%
|
|======================= | 33%
|
|=============================================== | 67%
|
|======================================================================| 100%
########################
# SingleCellExperiment #
########################
library(SingleCellExperiment)
set.seed(1234)
# Simulate counts
cnts <- mapply(function(x){rpois(n = 500, lambda = x)},
x = sample(1:100, 50, replace = TRUE))
rownames(cnts) <- paste0("gene_", 1:nrow(cnts))
colnames(cnts) <- paste0("cell_", 1:ncol(cnts))
sce <- SingleCellExperiment(assays=list(counts=cnts))
# (nonsensical) APL
runAPL(obj = sce,
group = 1:10,
dims = 10,
top = 500,
score = TRUE,
show_cols = TRUE,
type = "ggplot",
assay = "counts")
#>
#> Both dims and pd_use set. Using dimensions specified by dims.
#>
#> Using 10 dimensions.
#>
|
| | 0%
|
|======================= | 33%
|
|=============================================== | 67%
|
|======================================================================| 100%
 ###########
# Seurat #
###########
library(SeuratObject)
set.seed(1234)
# Simulate counts
cnts <- mapply(function(x){rpois(n = 500, lambda = x)},
x = sample(1:100, 50, replace = TRUE))
rownames(cnts) <- paste0("gene_", 1:nrow(cnts))
colnames(cnts) <- paste0("cell_", 1:ncol(cnts))
seu <- CreateSeuratObject(counts = cnts)
#> Warning: Feature names cannot have underscores ('_'), replacing with dashes ('-')
#> Warning: Data is of class matrix. Coercing to dgCMatrix.
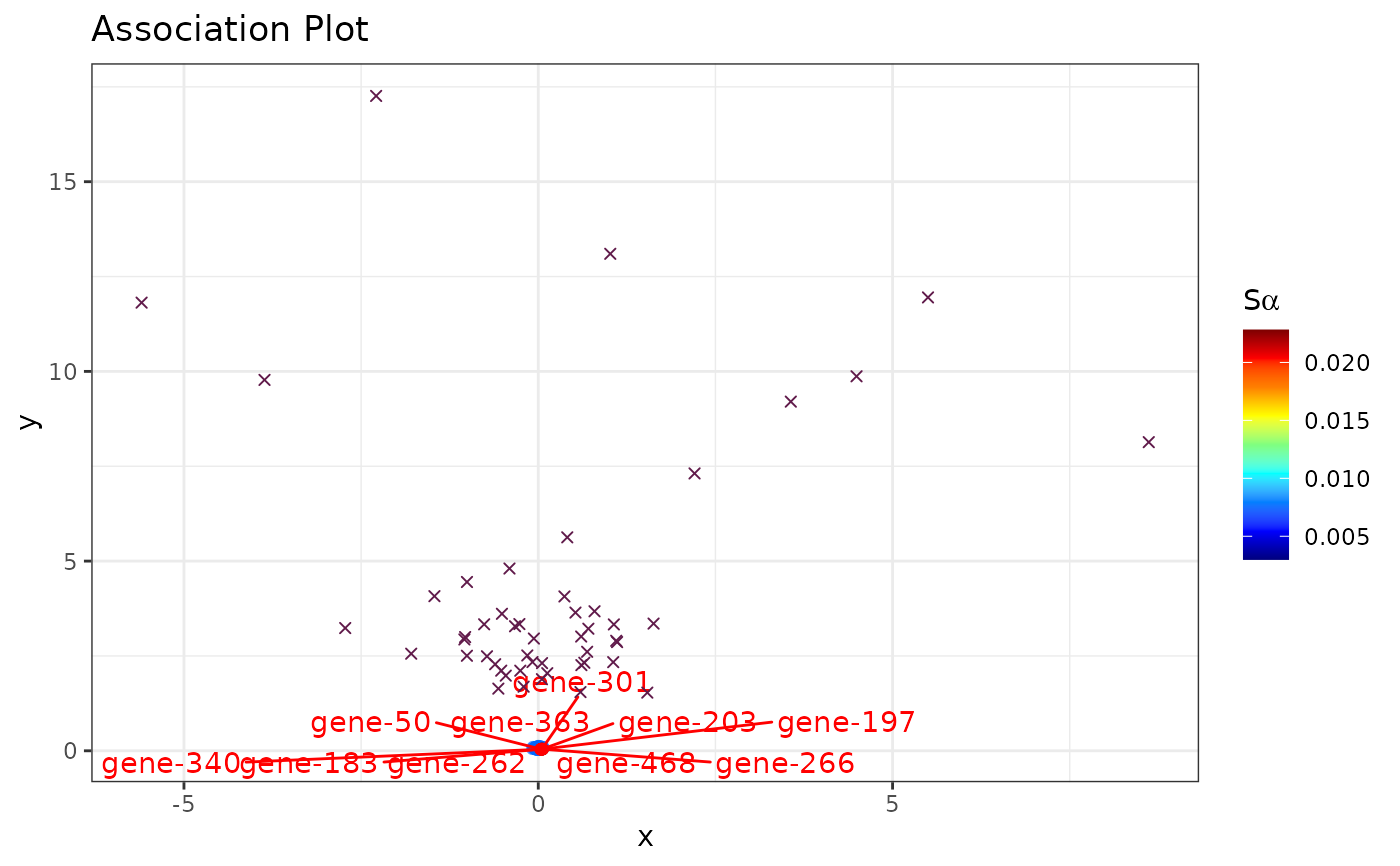
# (nonsensical) APL
runAPL(obj = seu,
group = 1:10,
dims = 10,
top = 500,
score = TRUE,
show_cols = TRUE,
type = "ggplot",
assay = "RNA",
slot = "counts")
#>
#> Both dims and pd_use set. Using dimensions specified by dims.
#>
#> Using 10 dimensions.
#>
|
| | 0%
|
|======================= | 33%
|
|=============================================== | 67%
|
|======================================================================| 100%
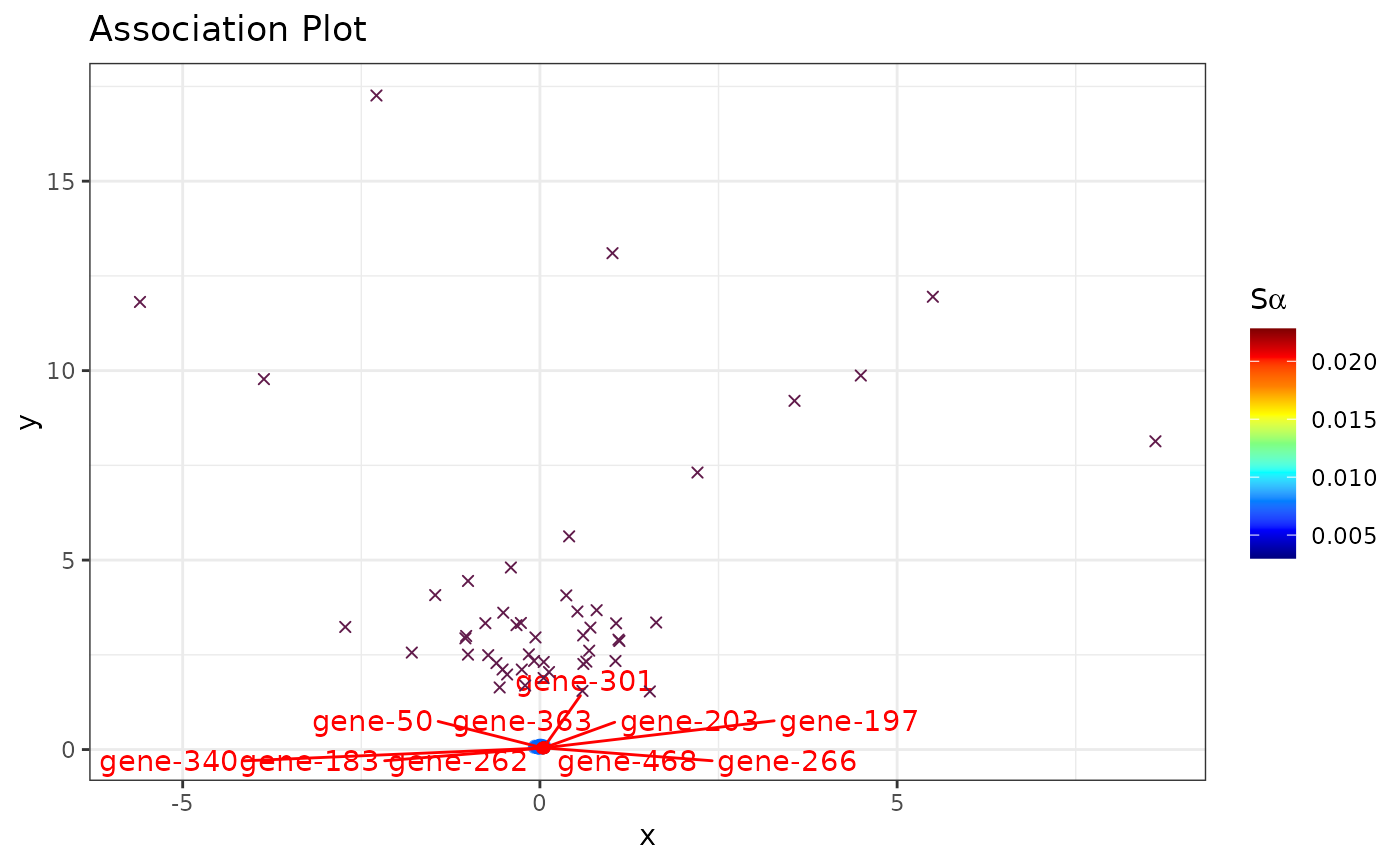
###########
# Seurat #
###########
library(SeuratObject)
set.seed(1234)
# Simulate counts
cnts <- mapply(function(x){rpois(n = 500, lambda = x)},
x = sample(1:100, 50, replace = TRUE))
rownames(cnts) <- paste0("gene_", 1:nrow(cnts))
colnames(cnts) <- paste0("cell_", 1:ncol(cnts))
seu <- CreateSeuratObject(counts = cnts)
#> Warning: Feature names cannot have underscores ('_'), replacing with dashes ('-')
#> Warning: Data is of class matrix. Coercing to dgCMatrix.
# (nonsensical) APL
runAPL(obj = seu,
group = 1:10,
dims = 10,
top = 500,
score = TRUE,
show_cols = TRUE,
type = "ggplot",
assay = "RNA",
slot = "counts")
#>
#> Both dims and pd_use set. Using dimensions specified by dims.
#>
#> Using 10 dimensions.
#>
|
| | 0%
|
|======================= | 33%
|
|=============================================== | 67%
|
|======================================================================| 100%
 set.seed(1234)
# Simulate counts
cnts <- mapply(function(x){rpois(n = 500, lambda = x)},
x = sample(seq(0.01,0.1,by=0.01), 50, replace = TRUE))
rownames(cnts) <- paste0("gene_", 1:nrow(cnts))
colnames(cnts) <- paste0("cell_", 1:ncol(cnts))
cnts <- Matrix::Matrix(cnts)
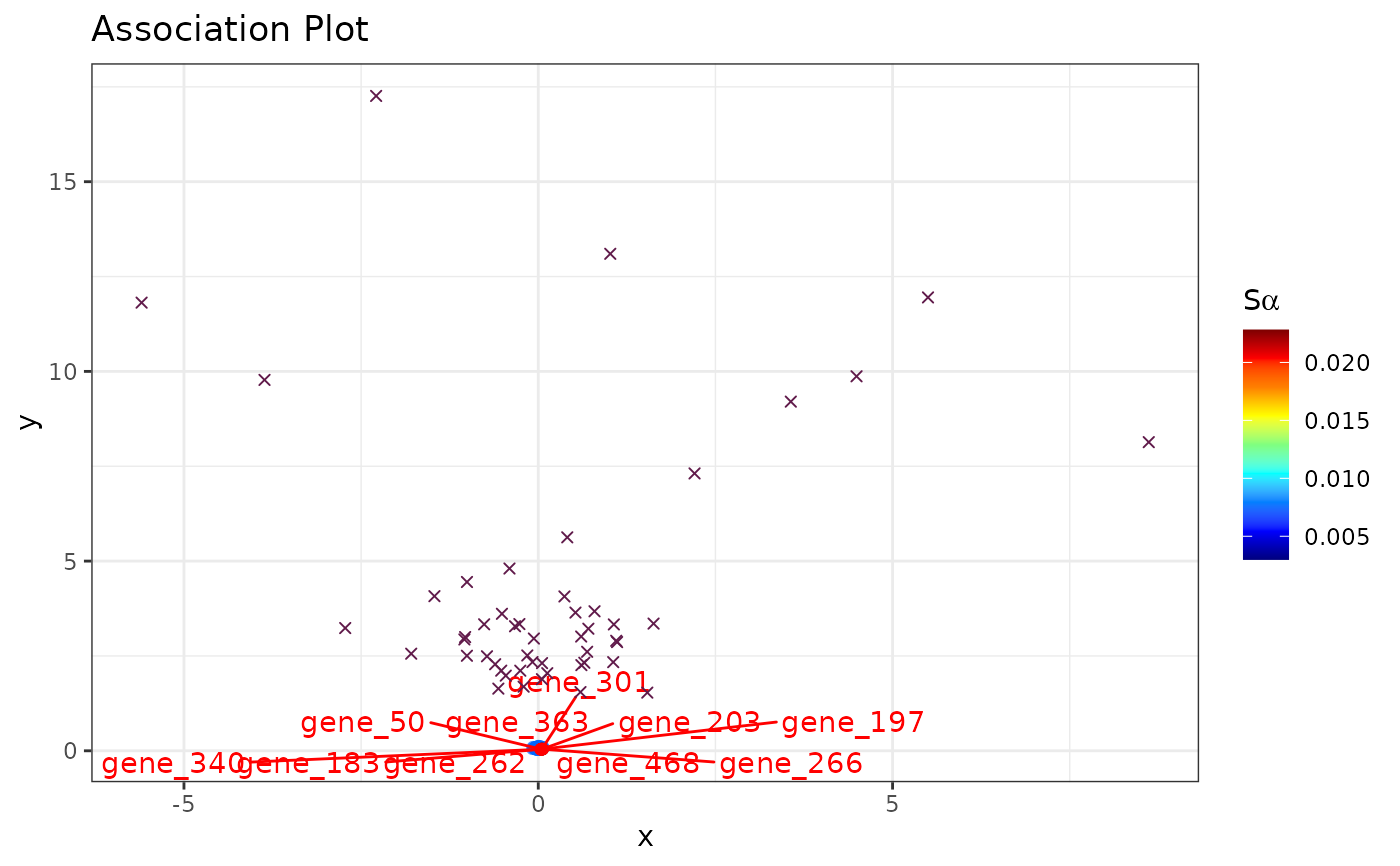
# (nonsensical) APL
runAPL(obj = cnts,
group = 1:10,
dims = 10,
top = 500,
score = TRUE,
show_cols = TRUE,
type = "ggplot")
#> Warning: Matrix contains rows with only 0s. These rows were removed. If undesired set rm_zeros = FALSE.
#>
#> Both dims and pd_use set. Using dimensions specified by dims.
#>
#> Using 10 dimensions.
#>
|
| | 0%
|
|======================= | 33%
|
|=============================================== | 67%
|
|======================================================================| 100%
#> Warning: No rows with a Score >= score_cutoff of 0. Choose lower cutoff.
set.seed(1234)
# Simulate counts
cnts <- mapply(function(x){rpois(n = 500, lambda = x)},
x = sample(seq(0.01,0.1,by=0.01), 50, replace = TRUE))
rownames(cnts) <- paste0("gene_", 1:nrow(cnts))
colnames(cnts) <- paste0("cell_", 1:ncol(cnts))
cnts <- Matrix::Matrix(cnts)
# (nonsensical) APL
runAPL(obj = cnts,
group = 1:10,
dims = 10,
top = 500,
score = TRUE,
show_cols = TRUE,
type = "ggplot")
#> Warning: Matrix contains rows with only 0s. These rows were removed. If undesired set rm_zeros = FALSE.
#>
#> Both dims and pd_use set. Using dimensions specified by dims.
#>
#> Using 10 dimensions.
#>
|
| | 0%
|
|======================= | 33%
|
|=============================================== | 67%
|
|======================================================================| 100%
#> Warning: No rows with a Score >= score_cutoff of 0. Choose lower cutoff.