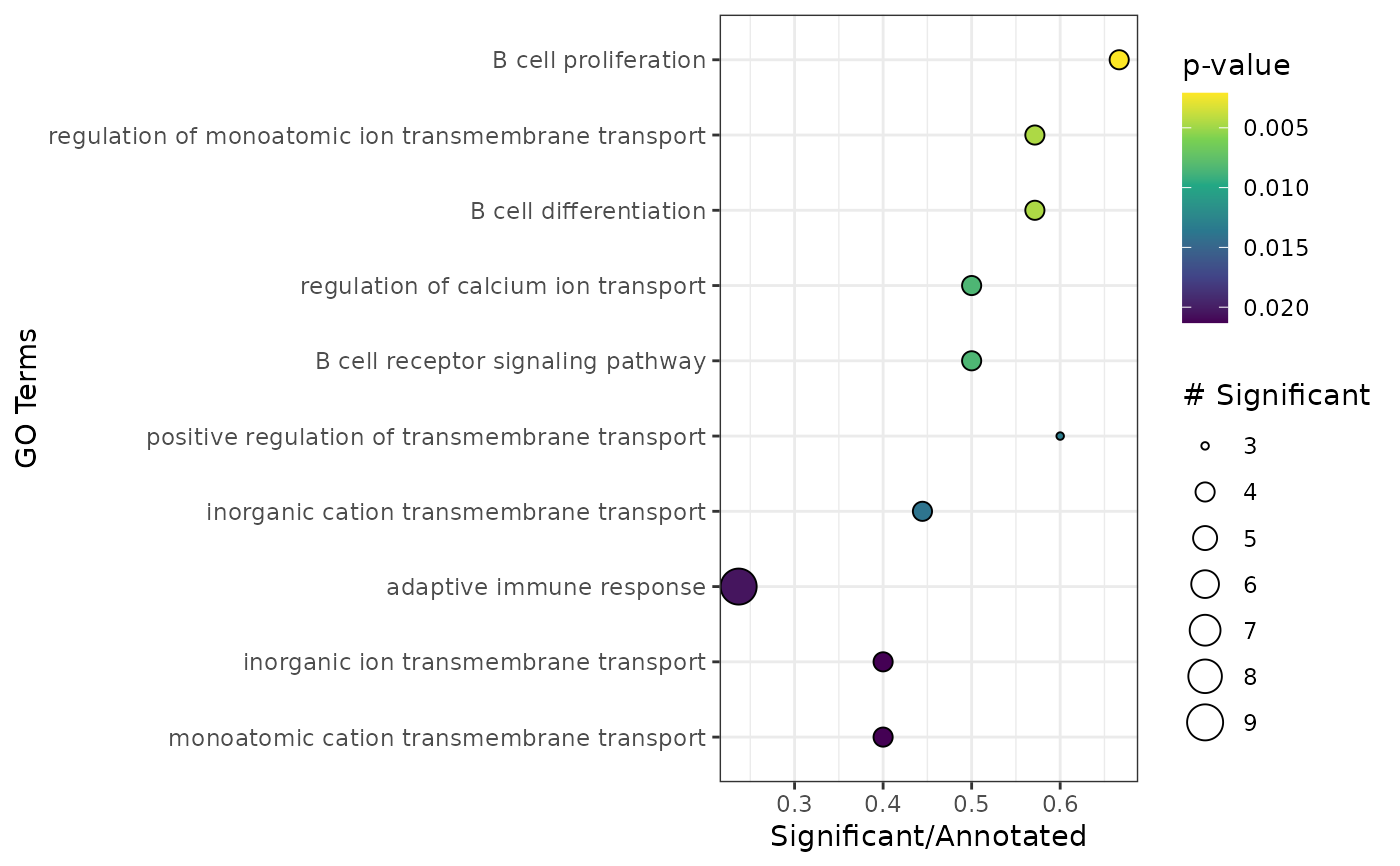
Run Gene overrepresentation analysis with topGO
apl_topGO.RdThis function uses the Kolmogorov-Smirnov test as implemented by the package topGO to test for overrepresentation in Gene Ontology gene sets.
Usage
apl_topGO(
  caobj,
  ontology,
  organism = "hs",
  ngenes = 1000,
  score_cutoff = 0,
  use_coords = FALSE,
  return_plot = FALSE,
  top_res = 15
)
Arguments
- caobj
A "cacomp" object with principal row coordinates and standardized column coordinates calculated.
- ontology
Character string. Chooses GO sets for 'BP' (biological processes), 'CC' (cell compartment) or 'MF' (molecular function).
- organism
Character string. Either 'hs' (homo sapiens), 'mm' (mus musculus) or the name of the organism package such as 'org.*.eg.db'.
- ngenes
Numeric. Number of top ranked genes to test for overrepresentation.
- score_cutoff
numeric. S-alpha score cutoff. Only genes with a score larger will be tested.
- use_coords
Logical. Whether the x-coordinates of the row APL coordinates should be used for ranking. Only recommended when no S-alpha score (see apl_score()) can be calculated.
- return_plot
Logical. Whether a plot of significant gene sets should be additionally returned.
- top_res
Numeric. Number of top scoring genes to plot.
Details
For a chosen group of cells/samples, the top 'ngenes' group specific genes are used for gene overrepresentation analysis. The genes are ranked either by the precomputed APL score, or, if not available by their APL x-coordinates.
References
Adrian Alexa and Jorg Rahnenfuhrer
topGO: Enrichment Analysis for Gene Ontology.
R package version 2.42.0.
Examples
library(SeuratObject)
#> Loading required package: sp
#> ‘SeuratObject’ was built under R 4.4.0 but the current version is
#> 4.4.2; it is recomended that you reinstall ‘SeuratObject’ as the ABI
#> for R may have changed
#>
#> Attaching package: ‘SeuratObject’
#> The following objects are masked from ‘package:base’:
#>
#>     intersect, t
set.seed(1234)
cnts <- SeuratObject::LayerData(pbmc_small, assay = "RNA", layer = "counts")
cnts <- as.matrix(cnts)

# Run CA on example from Seurat

ca <- cacomp(pbmc_small,
             princ_coords = 3,
             return_input = FALSE,
             assay = "RNA",
             slot = "counts")
#> Warning:
#> Parameter top is >nrow(obj) and therefore ignored.
#> No dimensions specified. Setting dimensions to: 15

grp <- which(Idents(pbmc_small) == 2)
ca <- apl_coords(ca, group = grp)
ca <- apl_score(ca,
                mat = cnts)
#>
  |
  |                                                                      |   0%
  |
  |=======                                                               |  10%
  |
  |==============                                                        |  20%
  |
  |=====================                                                 |  30%
  |
  |============================                                          |  40%
  |
  |===================================                                   |  50%
  |
  |==========================================                            |  60%
  |
  |=================================================                     |  70%
  |
  |========================================================              |  80%
  |
  |===============================================================       |  90%
  |
  |======================================================================| 100%

enr <- apl_topGO(ca,
                 ontology = "BP",
                 organism = "hs")
#>
#> groupGOTerms: 	GOBPTerm, GOMFTerm, GOCCTerm environments built.
#> Loading required package: org.Hs.eg.db
#> Loading required package: AnnotationDbi
#> Loading required package: stats4
#> Loading required package: BiocGenerics
#>
#> Attaching package: ‘BiocGenerics’
#> The following object is masked from ‘package:SeuratObject’:
#>
#>     intersect
#> The following objects are masked from ‘package:stats’:
#>
#>     IQR, mad, sd, var, xtabs
#> The following objects are masked from ‘package:base’:
#>
#>     Filter, Find, Map, Position, Reduce, anyDuplicated, aperm, append,
#>     as.data.frame, basename, cbind, colnames, dirname, do.call,
#>     duplicated, eval, evalq, get, grep, grepl, intersect, is.unsorted,
#>     lapply, mapply, match, mget, order, paste, pmax, pmax.int, pmin,
#>     pmin.int, rank, rbind, rownames, sapply, saveRDS, setdiff, table,
#>     tapply, union, unique, unsplit, which.max, which.min
#> Loading required package: Biobase
#> Welcome to Bioconductor
#>
#>     Vignettes contain introductory material; view with
#>     'browseVignettes()'. To cite Bioconductor, see
#>     'citation("Biobase")', and for packages 'citation("pkgname")'.
#> Loading required package: IRanges
#> Loading required package: S4Vectors
#>
#> Attaching package: ‘S4Vectors’
#> The following object is masked from ‘package:utils’:
#>
#>     findMatches
#> The following objects are masked from ‘package:base’:
#>
#>     I, expand.grid, unname
#>
#> Attaching package: ‘IRanges’
#> The following object is masked from ‘package:sp’:
#>
#>     %over%
#>
#> Building most specific GOs .....
#> 	( 1348 GO terms found. )
#>
#> Build GO DAG topology ..........
#> 	( 3594 GO terms and 7817 relations. )
#>
#> Annotating nodes ...............
#> 	( 207 genes annotated to the GO terms. )
#>
#> 			 -- Elim Algorithm --
#>
#> 		 the algorithm is scoring 519 nontrivial nodes
#> 		 parameters:
#> 			 test statistic: fisher
#> 			 cutOff: 0.01
#>
#> 	 Level 12:	1 nodes to be scored	(0 eliminated genes)
#>
#> 	 Level 11:	7 nodes to be scored	(0 eliminated genes)
#>
#> 	 Level 10:	17 nodes to be scored	(8 eliminated genes)
#>
#> 	 Level 9:	24 nodes to be scored	(11 eliminated genes)
#>
#> 	 Level 8:	53 nodes to be scored	(17 eliminated genes)
#>
#> 	 Level 7:	74 nodes to be scored	(19 eliminated genes)
#>
#> 	 Level 6:	103 nodes to be scored	(27 eliminated genes)
#>
#> 	 Level 5:	101 nodes to be scored	(27 eliminated genes)
#>
#> 	 Level 4:	74 nodes to be scored	(27 eliminated genes)
#>
#> 	 Level 3:	50 nodes to be scored	(27 eliminated genes)
#>
#> 	 Level 2:	14 nodes to be scored	(27 eliminated genes)
#>
#> 	 Level 1:	1 nodes to be scored	(27 eliminated genes)

plot_enrichment(enr)
