Generates plot for results from apl_topGO
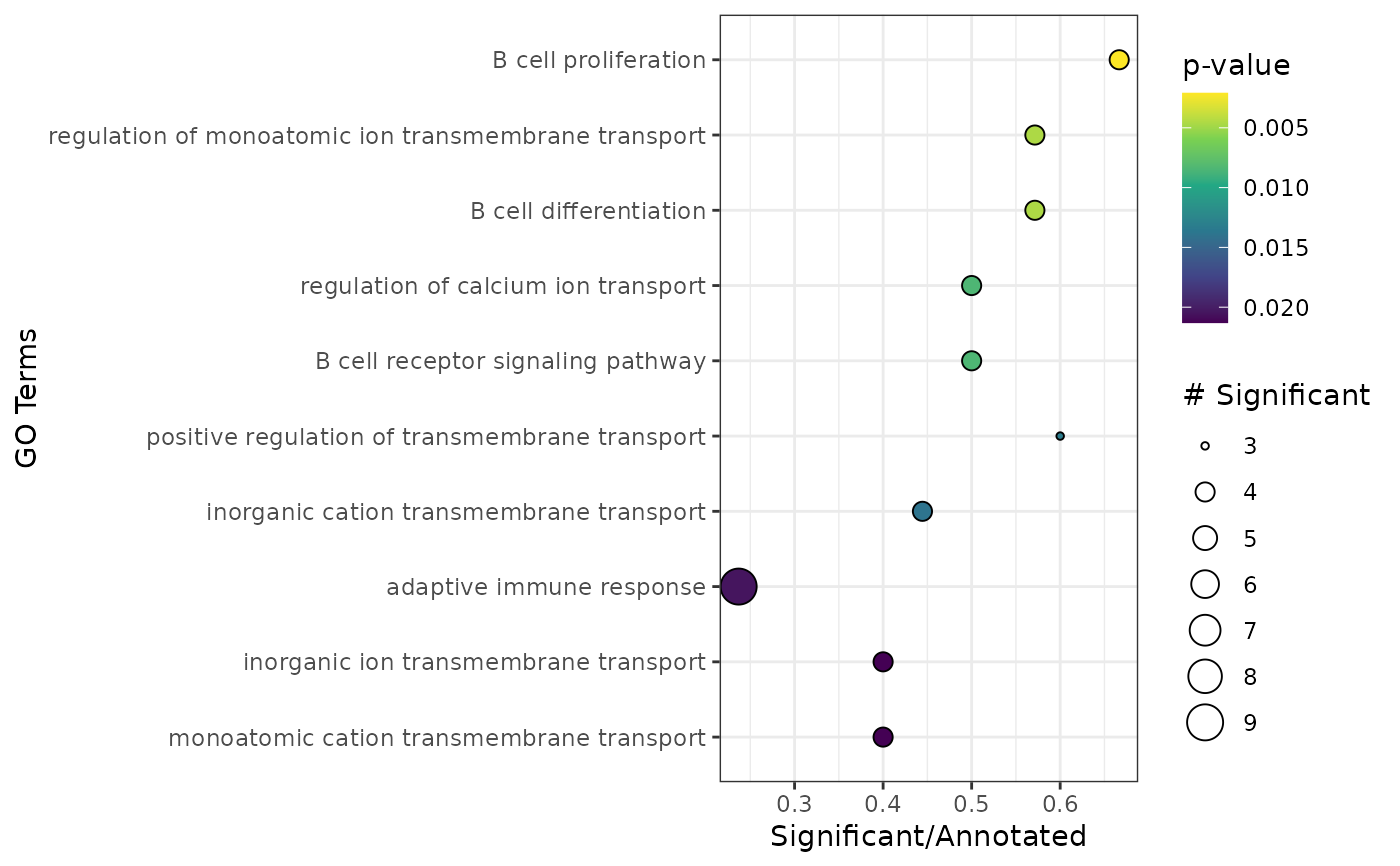
plot_enrichment.RdPlots the results from the data frame generated via apl_topGO.
Examples
library(SeuratObject)
set.seed(1234)
cnts <- SeuratObject::LayerData(pbmc_small, assay = "RNA", layer = "counts")
cnts <- as.matrix(cnts)

# Run CA on example from Seurat

ca <- cacomp(pbmc_small,
             princ_coords = 3,
             return_input = FALSE,
             assay = "RNA",
             slot = "counts")
#> Warning:
#> Parameter top is >nrow(obj) and therefore ignored.
#> No dimensions specified. Setting dimensions to: 15

grp <- which(Idents(pbmc_small) == 2)
ca <- apl_coords(ca, group = grp)
ca <- apl_score(ca,
                mat = cnts)
#>
  |
  |                                                                      |   0%
  |
  |=======                                                               |  10%
  |
  |==============                                                        |  20%
  |
  |=====================                                                 |  30%
  |
  |============================                                          |  40%
  |
  |===================================                                   |  50%
  |
  |==========================================                            |  60%
  |
  |=================================================                     |  70%
  |
  |========================================================              |  80%
  |
  |===============================================================       |  90%
  |
  |======================================================================| 100%

enr <- apl_topGO(ca,
                 ontology = "BP",
                 organism = "hs")
#>
#> groupGOTerms: 	GOBPTerm, GOMFTerm, GOCCTerm environments built.
#>
#> Building most specific GOs .....
#> 	( 1348 GO terms found. )
#>
#> Build GO DAG topology ..........
#> 	( 3594 GO terms and 7817 relations. )
#>
#> Annotating nodes ...............
#> 	( 207 genes annotated to the GO terms. )
#>
#> 			 -- Elim Algorithm --
#>
#> 		 the algorithm is scoring 519 nontrivial nodes
#> 		 parameters:
#> 			 test statistic: fisher
#> 			 cutOff: 0.01
#>
#> 	 Level 12:	1 nodes to be scored	(0 eliminated genes)
#>
#> 	 Level 11:	7 nodes to be scored	(0 eliminated genes)
#>
#> 	 Level 10:	17 nodes to be scored	(8 eliminated genes)
#>
#> 	 Level 9:	24 nodes to be scored	(11 eliminated genes)
#>
#> 	 Level 8:	53 nodes to be scored	(17 eliminated genes)
#>
#> 	 Level 7:	74 nodes to be scored	(19 eliminated genes)
#>
#> 	 Level 6:	103 nodes to be scored	(27 eliminated genes)
#>
#> 	 Level 5:	101 nodes to be scored	(27 eliminated genes)
#>
#> 	 Level 4:	74 nodes to be scored	(27 eliminated genes)
#>
#> 	 Level 3:	50 nodes to be scored	(27 eliminated genes)
#>
#> 	 Level 2:	14 nodes to be scored	(27 eliminated genes)
#>
#> 	 Level 1:	1 nodes to be scored	(27 eliminated genes)

plot_enrichment(enr)